Chapter 18 — Economic Growth
Cambridge International AS & A Level Economics (9708) · Unit 4.4 · 4th edition coursebook
Learning objectives
- Define the meaning of economic growth.
- Describe how economic growth is measured.
- Explain the difference between growth in nominal GDP and real GDP.
- Analyse the causes of economic growth.
- Discuss the consequences of economic growth.
Key terms
- economic development
- An increase in welfare and quality of life.
- nominal (or money) GDP
- Total output measured in current prices.
- real GDP
- Total output measured in constant prices.
- base year
- The reference point in time. It is the starting year in an index and is given a value of 100.
- constant prices
- Prices in a base year.
- price index
- A way of comparing changes in the price level over time. The value of the first year in the index (base year) is set at 100 and the value of each following year is a percentage of it.
- GDP deflator
- The price index of all domestically produced goods and services.
- recession
- A decline in real GDP over at least two consecutive quarters.
18.1Economic growth
Economic growth is one of the key indicators of macroeconomic performance. Economic growth is an increase in an economy's output, and the economic growth rate is the annual percentage change in output. For people in a country to enjoy more goods and services on average, output has to rise by more than the population: in that case GDP per head (per capita) increases.
For many years it was assumed that sustained economic growth would automatically eradicate poverty, and growth and development were treated as the same thing. The idea was that a larger flow of goods and services would 'trickle down' to all members of society, including the poor, in the form of jobs and other economic benefits. In practice, economic growth does not always raise living standards or quality of life for everyone in an economy. It is also possible for a large share of the population to see an improvement in living standards and quality of life without growth — for example through a more equal distribution of income, or a reduction in pollution.
For this reason a wider definition of economic development is now accepted, related to but distinct from economic growth. Economic development is the process of improving people's economic well-being and quality of life.
Key concept link — Progress and development
Economic growth is perhaps the key measure of progress in an economy. This can be assessed by examining economic data. To assess whether an economy is developing is a more normative judgement.
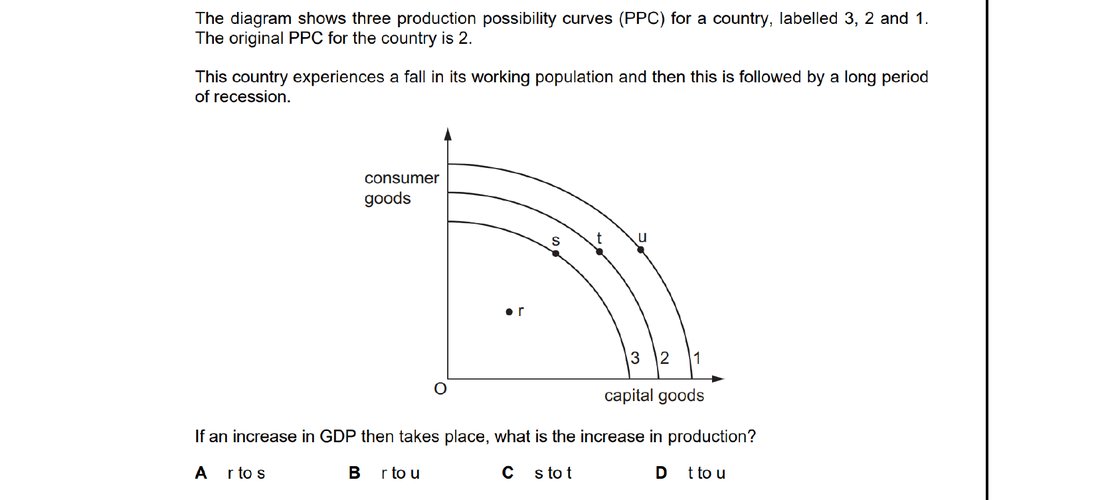
A falling working population shifts the PPC inward (from curve 2 to curve 1); a recession then moves the economy to a point inside that smaller PPC. A subsequent rise in GDP without any change in resources must therefore be a movement from inside the curve towards it — using existing factors more fully — which corresponds to the path r to s.
18.2Measurement of economic growth
Economic growth is measured by changes in real GDP — the country's output adjusted for changes in prices. The economic growth rate is the percentage change in real GDP from one period to another, usually a year. Government statisticians first measure GDP at the prices ruling at the time the output is produced, then strip out the effect of changes in the price level to obtain real GDP.
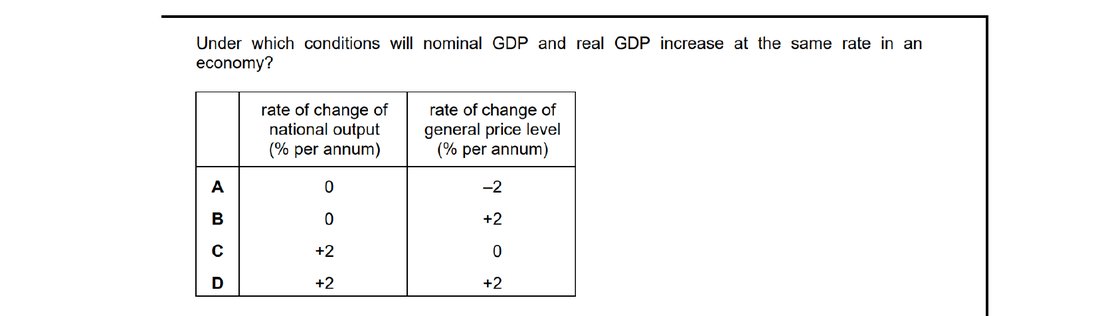
Real GDP equals nominal GDP adjusted for price changes. If real and nominal output grow at the same rate, the price level must be unchanged. Option C — real output rising by 2% per annum while the general price level is unchanged — is the only combination where the two rates of change must be equal.
18.3Nominal GDP and real GDP
Nominal (or money) GDP is GDP measured in the prices operating in the year in which output is produced. It is also called GDP at current prices and is not adjusted for changes in the price level.
Nominal GDP can give a misleading picture of how well a country is performing, because its value can rise simply because prices have risen, even if the quantity of goods and services produced has not changed. If, for example, 100 billion products are produced at an average price that rises from one year to the next, nominal GDP will appear higher even though output is unchanged.
To get a truer picture of what is happening to output, economists convert nominal GDP into real GDP by measuring it at constant prices — the prices ruling in a chosen base year. This removes the effect of inflation on the figure.
Real GDP can be calculated using a price index:
Real GDP = nominal GDP × (price index in base year ÷ price index in current year)
The price index used to deflate nominal GDP is the GDP deflator, which measures the prices of products produced — rather than consumed — in the country. It therefore includes the prices of capital goods as well as consumer products, and the prices of exports, but excludes the prices of imports.
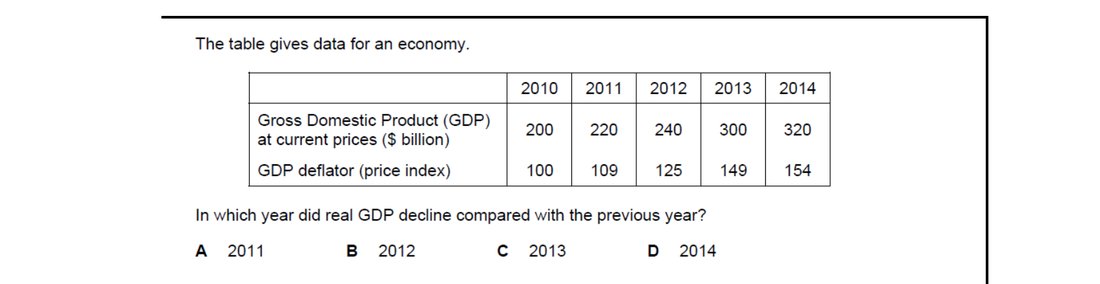
Real GDP = nominal GDP / deflator × 100. Real GDP falls only when the deflator rises faster than nominal GDP. Working through the figures year-by-year, real GDP rises every year except 2012, when the jump in the deflator outpaces the rise in nominal GDP, so real GDP falls compared with 2011.
18.4Causes and consequences of economic growth
Economic growth can arise either from making fuller use of existing resources or from increases in the quantity and quality of those resources.
Growth from higher aggregate demand
If an economy has spare capacity, output can rise as a result of an increase in aggregate demand. Greater consumer confidence can raise consumer expenditure; an increase in government spending and cuts in taxes and interest rates can also stimulate AD. More factors of production are then employed, and output rises. On a production possibility curve diagram, this kind of growth is shown as a movement from a point inside the PPC towards a point closer to the curve — the economy is using existing resources more fully rather than expanding what it could produce (see Figure 18.2). On an AD/AS diagram, the AD curve shifts to the right, and on the Keynesian-shaped AS curve real GDP rises because previously unemployed resources are brought back into use (see Figure 18.3).
Growth from increases in productive capacity
Growth that can be sustained over time requires productive capacity itself to expand. There are two broad routes: more resources, or better quality resources.
Increase in the quantity of resources. The supply of labour and entrepreneurs can rise through a natural increase in population, or more quickly through net immigration of people of working age. Government policy can also raise the supply of workers — for example a rise in the retirement age — and deregulation and privatisation can encourage entrepreneurship. Net investment, where firms buy more capital goods than are needed to replace those taken out of use, raises the supply of capital. The quantity of land can rise through discoveries such as new oil fields or gold mines.
Increase in the quality of resources. Improvements in quality raise the productivity of factor inputs. Education, training and better healthcare improve the quality of labour and entrepreneurship. The quality of capital goods rises with advances in technology. Fertilisers and irrigation and drainage schemes can improve the quality of land.
An increase in productive capacity is shown by a shift of the PPC to the right and by a shift of the LRAS curve to the right (see Figure 18.4); the economy is now capable of producing a higher maximum combination of consumer goods and capital goods. For the rise in productive capacity actually to raise output, however, it must be put to use. If both productive capacity and aggregate demand rise, output rises but the economy can still be inside its PPC — there may still be unemployed workers or unused machines, so it would be possible to produce more of one type of good without giving up any of the other. Maximum output is only achieved if AD intersects LRAS on its vertical section.
Key concept link — Efficiency and inefficiency
When an economy is producing inside its PPC, it is inefficient.
Negative economic growth
Economic growth can be negative — real GDP can fall. A decline in real GDP over two consecutive quarters (six months) or more is called a recession. Output may decline because aggregate demand falls or because aggregate supply falls.
Economic growth in low-income countries
The main obstacle to raising the quantity and quality of resources in some low-income countries is the opportunity cost of moving resources away from their current use. Devoting more resources to education may mean fewer for healthcare; producing more capital goods may require sacrificing consumer goods in the short run, which would temporarily reduce living standards. Research and development that drives advances in technology also uses resources that have alternative uses.
Key concept link — Scarcity and choice
The choice between producing extra capital goods and fewer consumer goods or producing the same quantity of both types of goods arises because of scarcity.
The costs and benefits of economic growth
Costs. If the economy is operating at full capacity, growth carries an opportunity cost: producing more capital goods to expand future capacity means moving resources away from consumer goods, so current consumption has to fall. This is a short-run cost — in the long run, the higher stock of capital allows both more capital goods and more consumer goods to be produced.
Other potential costs can exist in both the short and the long run. A growing economy is a dynamic, changing economy in which some industries expand and others decline. Workers may have to learn new skills, change occupation, or move to a new region, and some find these adjustments stressful. Growth may also bring longer working hours and pressure to come up with new ideas. In addition, economic growth may be accompanied by depletion of natural resources and damage to the environment — for example using more oil, depleting fish stocks, building on areas of natural beauty, or creating more pollution.
Benefits. The main benefit of economic growth is the increase in goods and services available for citizens to enjoy, which can raise living standards. Growth makes it easier to help the poor: higher incomes generate higher tax revenue, some of which can be used for higher benefits, better housing, better education and better healthcare, without the government having to raise tax rates on higher-income groups. Growth tends to be accompanied by higher employment — extra AD creates jobs, and a rise in aggregate supply can make a country's products more internationally competitive. A stable rate of growth raises business and consumer confidence and so encourages further investment; growth can therefore reinforce itself. Growth may also raise a country's international prestige and power.
In high-income countries some economists debate whether the benefits of further growth outweigh the costs. In low-income countries, growth is generally seen as essential to bring people out of poverty.
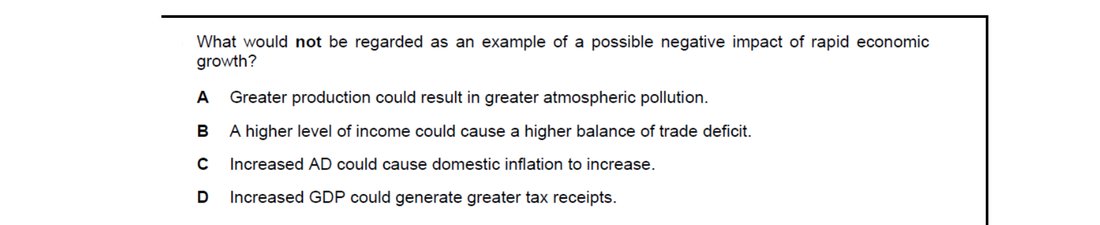
Rapid growth has many drawbacks — environmental damage, demand-pull inflation, and worsening trade balances as imports rise. Higher tax receipts from a larger GDP, by contrast, is a benefit: it gives government more revenue to fund services or reduce borrowing. So it would not be regarded as a negative impact of growth.
End-of-chapter practice
Past-paper questions from CIE 9708. Pick A, B, C or D. Answers are saved on this device — press Download report (PDF) at the top to save them.
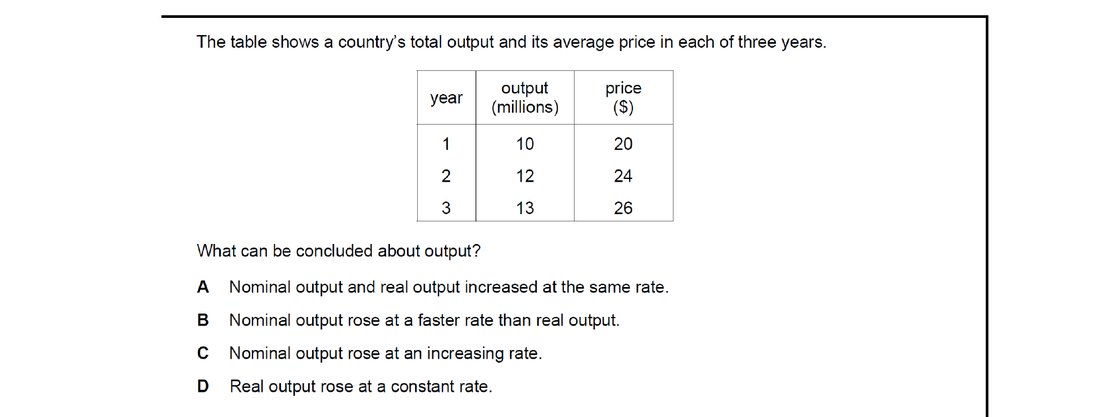
Real output is the quantity column (10, 12, 13); nominal output is price × quantity (200, 288, 338). Real output rises ~20% then ~8%, while nominal output rises ~44% then ~17%. So nominal output rises at a faster rate than real output in each year, reflecting the simultaneous rise in the price level.
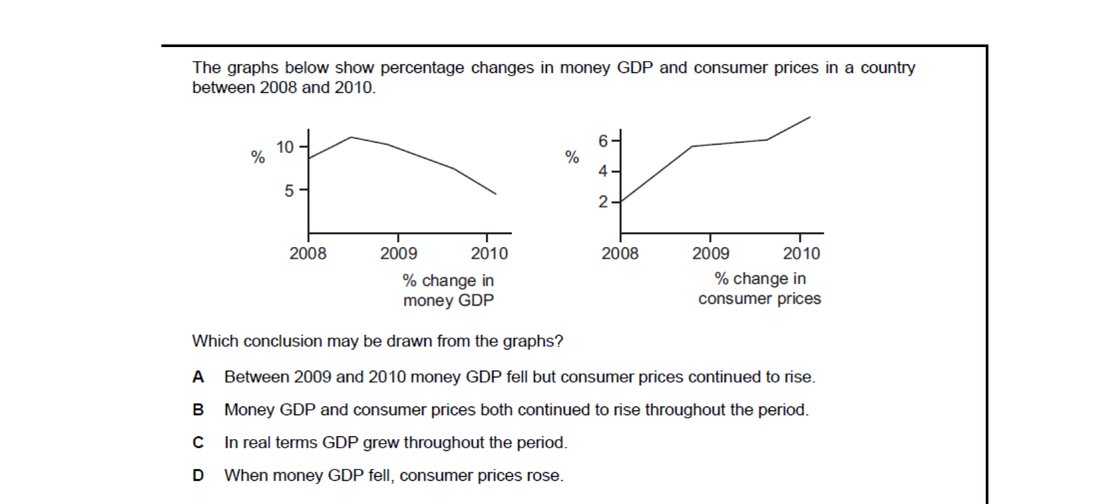
The graphs show positive percentage changes in both money GDP and consumer prices in every year of the period. Whenever those percentages are positive — even if they shrink — the underlying levels keep rising. So money GDP and the consumer price level both continued to rise throughout 2008-2010.
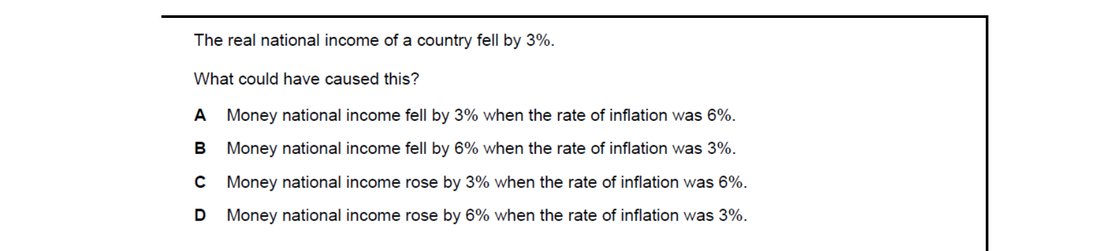
Real GDP growth approximately equals nominal GDP growth minus the inflation rate. For real income to fall by 3%, we need nominal growth minus inflation to equal −3%. Option C — nominal income rising by 3% while inflation is 6% — gives 3 − 6 = −3%, exactly matching the observed fall in real income.
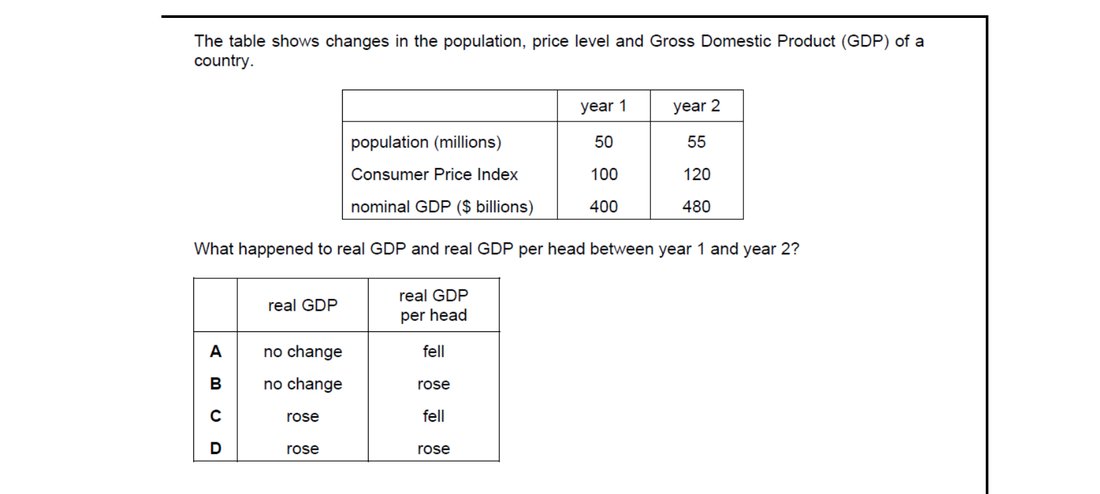
Real GDP = nominal GDP × 100 / CPI. Nominal GDP rose from $400bn to $480bn (+20%) and CPI from 100 to 120 (+20%), so real GDP is unchanged ($400bn in both years). Real GDP per head falls because the same real output is divided by a larger population (50m to 55m), so per-head income falls even though aggregate real output does not.
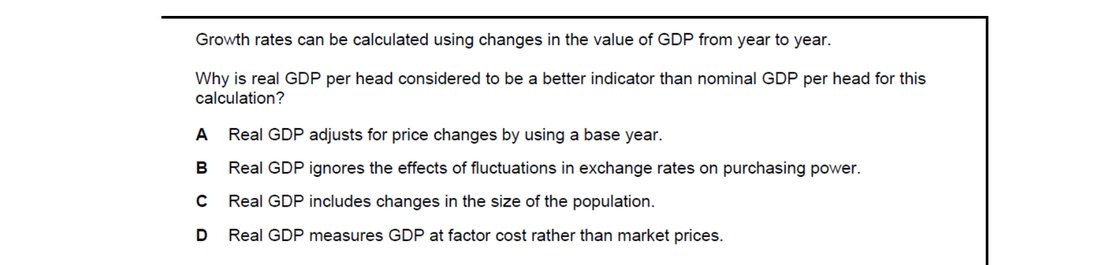
Nominal GDP per head rises whenever prices rise, even if real output is unchanged, giving a misleading picture of growth. Real GDP corrects for this by valuing output at base-year prices, stripping out inflation. So it is the adjustment for price changes — using a base year as reference — that makes real GDP per head the better growth indicator.
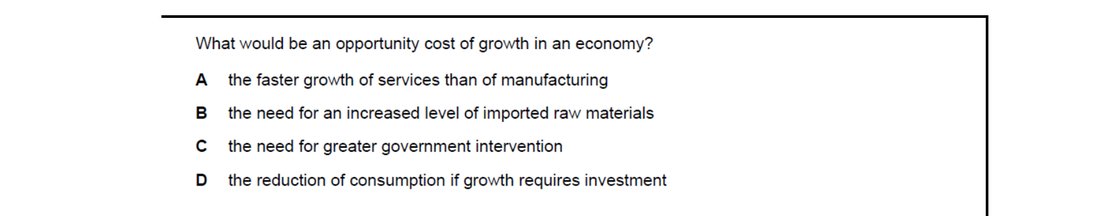
Opportunity cost is the next-best alternative forgone. Faster growth typically requires more investment, and resources used to produce capital goods today cannot also be used to produce consumer goods today. The lost current consumption is therefore the genuine opportunity cost of pursuing growth — exactly what option D identifies.
Attempt the practice questions above to build your score.
Self-evaluation checklist
After studying this chapter, you should be able to:
- Describe economic growth as a key indicator of macroeconomic performance.
- Explain how economic growth is measured by changes of GDP.
- Understand that nominal GDP has not been adjusted for inflation; real GDP has been adjusted for inflation.
- Analyse how economic growth may be caused by increases in aggregate demand and/or increases in the quantity and quality of resources.
- Discuss the advantages and disadvantages of economic growth.
Want more practice? Drill this chapter's past-paper MCQs (39 questions) →