Chapter 16 — Introduction to the Circular Flow of Income
Cambridge International AS & A Level Economics (9708) · Unit 4.2 · 4th edition coursebook
Learning objectives
- Define the circular flow of income.
- Explain the difference between the circular flow of income in a closed economy and in an open economy: the flow of income between households, firms and the government and the international economy.
- Analyse the impact of injections and leakages on the circular flow of income.
- Identify the difference between the country's income being in equilibrium and being in disequilibrium.
Key terms
- open economy
- An economy that is involved in trade with other economies.
- closed economy
- An economy that does not trade with other economies.
- injections
- Additions to the circular flow of income.
- leakages
- Withdrawals from the circular flow of income.
16.1The circular flow of income
The circular flow of income is a model that shows how income, spending and output move continuously around an economy. The simplest version has just two sectors and shows that the output produced by firms generates income for the households who supply factors of production, and that this income is then spent on the firms' output (see Figure 16.2). Because the same flow can be measured at three points, output equals income equals expenditure at the national level. This identity is the reason GDP can be measured by the output, income and expenditure methods.
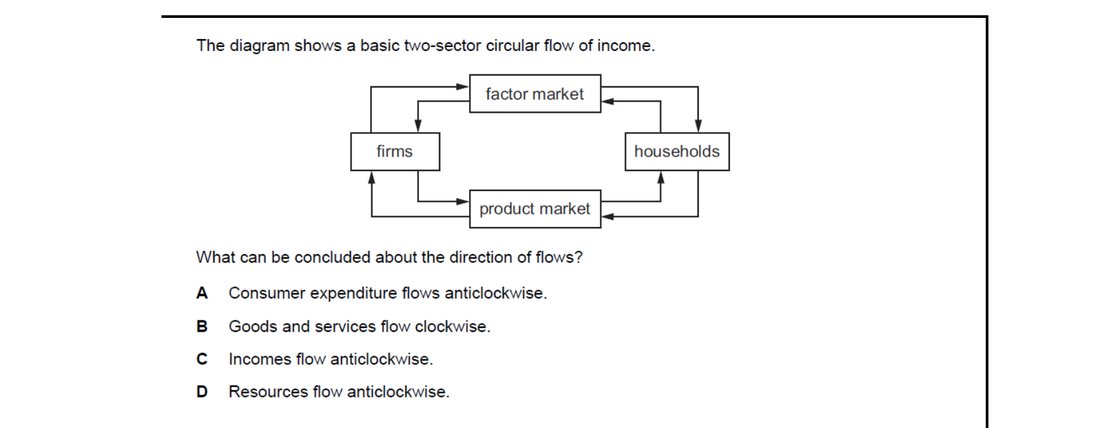
In the standard two-sector diagram, money flows clockwise (incomes from firms to households, consumer expenditure from households to firms) while the real flows go anticlockwise — households supply factor services (land, labour, capital) to firms in the factor market, and firms supply goods and services to households in the product market. Resources therefore flow anticlockwise.
16.2The difference between an open and a closed economy
A closed economy does not export or import goods and services; an open economy does. No real economy is completely closed, but the closed-economy model is a useful starting point because it isolates the domestic relationships between households, firms, and (when added) the government.
The circular flow in a closed economy and an open economy
In a closed economy the flow can be drawn with two concentric circles (see Figure 16.3). The inner circle shows the real flow: households supply factor services (labour, capital, entrepreneurship and land) to firms, and firms supply goods and services to households. The outer circle shows the money flow that mirrors the real flow in the opposite direction: firms make factor payments (wages, interest, profit and rent) to households, and households spend their income on goods and services produced by firms.
An open economy adds two more sectors: the government and the international economy (see Figure 16.4). The government collects taxes from households and firms and spends on goods and services. The international economy buys the country's exports and supplies its imports. The flow now includes leakages and injections at multiple points, but the basic identity still holds.
16.3The impact of injections and leakages on the circular flow
The simple two-sector closed-economy model assumes that all income earned by households is spent on goods and services produced domestically by firms, and that firms in turn pay all of their sales revenue back to households as factor incomes. In practice, this is not what happens. Some income earned by households does not return directly to domestic firms, and some spending on domestic output comes from sources other than current household income. To make the model realistic, the circular flow must be opened up to include a government sector and an international sector, and the additional flows that this introduces must be identified.
There are three flows that take income out of the circular flow. These are called leakages or withdrawals. The first is saving: income that households choose not to spend. The second is taxation: income that the government takes through direct taxes on incomes and profits and indirect taxes on spending. The third is spending on imports, where domestic income flows to foreign firms rather than to domestic producers.
There are three corresponding flows that add new spending to the circular flow. These are called injections. The first is investment: spending by firms on capital goods, which is financed largely from saving channelled through the financial system rather than from the firms’ own current sales. The second is government spending on goods and services. The third is spending by foreign buyers on the country’s exports, which brings income from abroad into the domestic flow.
An open-economy circular flow diagram shows the inner real flow of factor services from households to firms and of goods and services from firms to households, and the outer money flow of factor incomes from firms to households and of consumer spending from households to firms. Around this central loop, the three leakages are shown branching out of the flow (saving to the financial sector, taxation to the government, and import spending to foreign firms) and the three injections are shown branching back into the flow (investment from the financial sector, government spending from the government, and export revenue from foreign buyers).
Injections add to spending in the economy, while leakages reduce it. The size and direction of change in the circular flow at any moment depends on the balance between the two. When injections exceed leakages, more spending enters the flow than leaves it, and national income tends to rise. When leakages exceed injections, more spending leaves the flow than enters it, and national income tends to fall.
A leakage withdraws spending from the circular flow, so an injection of equivalent size restores it. Of the options, only an increase in investment is an injection: it adds firms' spending on capital goods back into the flow, offsetting the withdrawal. Cutting consumption or government spending, or raising the interest rate, would each reduce spending and worsen the leakage.
16.4Equilibrium and disequilibrium income
National income is in equilibrium when total injections equal total leakages, that is, when I + G + X = S + T + M. At this point there is no tendency for income to rise or fall, because the spending entering the flow is exactly matched by what leaves it.
If injections exceed leakages, extra spending enters the economy: production, income and spending all rise, lifting equilibrium GDP to a higher level. If leakages exceed injections, more spending leaves the flow than is added back, so production and income fall.
Two-sector and four-sector cases
In a two-sector economy (households and firms only) the equilibrium condition simplifies to I = S, as shown in Figure 16.5. A rise in investment raises GDP (see Figure 16.6); a rise in saving has the opposite effect because some output goes unsold and firms cut production.
In a four-sector economy with a government and an international sector, the condition is I + G + X = S + T + M (see Figure 16.7). Income moves to a higher equilibrium if any injection rises or any leakage falls; it moves to a lower equilibrium if any leakage rises or any injection falls. For example, a rise in tax rates with government spending unchanged leaves households and firms with less to spend, so income contracts to a new lower equilibrium (see Figure 16.8). A rise in saving or imports has a similar contractionary effect, at least in the short run.
Key concept link
The circular flow of income shows how and why macroeconomic equilibrium can change.
Equilibrium needs total injections to equal total leakages. Option B raises an injection (investment +$30bn) and cuts a leakage (saving −$30bn) simultaneously — both shift the economy the same way, creating a $60bn excess of injections over leakages. Each of the other options pairs offsetting changes that leave the injections-leakages balance unchanged.
16.5Links between injections and leakages
Injections and leakages are not independent of each other over time. As an injection raises incomes, people earn more and tend to save more, so the savings leakage grows. Extra savings, in turn, can finance more investment, completing one feedback loop. Higher government spending raises incomes and so raises tax revenue; the tax leakage tends to rise behind the government-spending injection.
A similar feedback runs through trade. A greater value of exports raises incomes, and as incomes rise, households spend more not only on domestically produced goods but also on imports. The import leakage therefore rises with the export injection. In the long run these feedbacks tend to bring the economy back towards equilibrium: an injection raises GDP until leakages have risen enough to match it again.
Key concept link
An injection will cause GDP to increase until, after a time, leakages rise to match the higher total injections.

In equilibrium, total injections equal total leakages: I + G + X = S + T + M, which rearranges to S = I + (G − T) + (X − M). With I = $50bn, a budget surplus of $20bn meaning (G − T) = −$20bn, and a trade deficit of $20bn meaning (X − M) = −$20bn, saving = 50 − 20 − 20 = $10bn.
End-of-chapter practice
Past-paper questions from CIE 9708. Pick A, B, C or D. Answers are saved on this device — press Download report (PDF) at the top to save them.
Withdrawals (leakages) from the circular flow are saving, taxation and imports. Higher income tax raises T; spending more on imported cars raises M; taking money out of savings reduces S. But shifting money from one bank account to another is purely a portfolio change with no effect on saving, taxation or imports, so total withdrawals are unchanged.
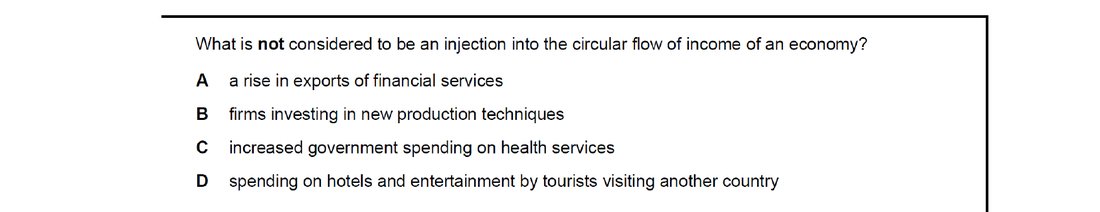
Injections are spending that enters the circular flow from outside the household-firm income loop: investment, government spending and exports. Domestic households spending abroad while travelling is imports — money leaving the home economy — so it is a leakage, not an injection. The other three options are an export, an investment and government spending respectively.
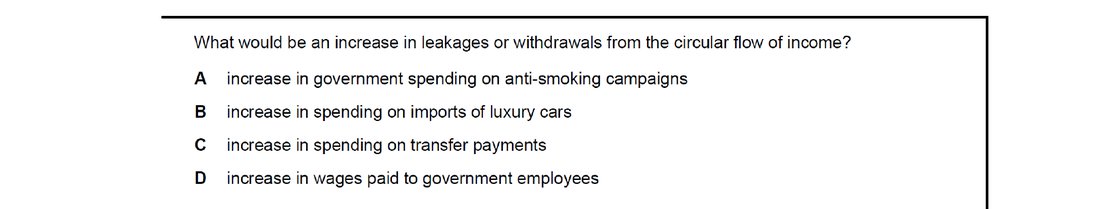
Leakages remove income from the circular flow: saving, taxation and import spending. Higher spending on imported luxury cars is extra import expenditure, sending income out of the domestic economy — a clear rise in leakages. Government spending on campaigns, transfer payments and wages all return money to the flow as injections or transfers within it.
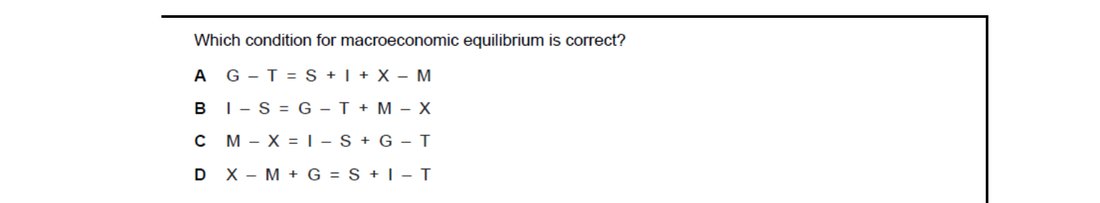
The macroeconomic equilibrium condition is I + G + X = S + T + M (total injections equal total leakages). Rearranging by moving X to the right and S, G, T to the left gives M − X = I − S + G − T, which is exactly option C. The other options misplace at least one sign.
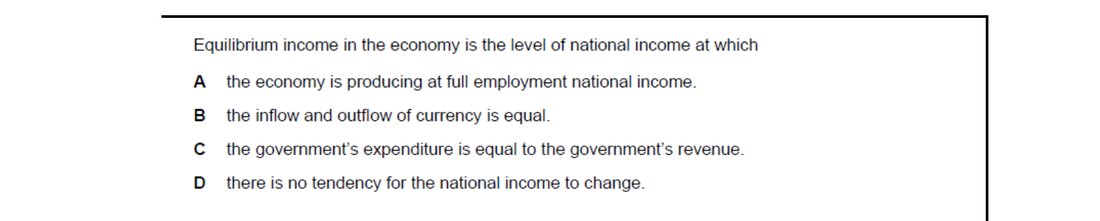
Equilibrium income is defined as the level of national income at which planned injections equal planned leakages, so there is no pressure for income to rise or fall — that is, no tendency for national income to change. Equilibrium does not require full employment, a balanced budget or balanced currency flows.
Leakages from the circular flow are saving, taxation and imports. A government budget surplus means tax revenue exceeds government spending, so net injections from the government sector are negative — taxation (a leakage) outweighs G (an injection). A trade surplus and re-invested profits both add to the flow, while a fall in R&D funding is not itself a leakage.
Attempt the practice questions above to build your score.
Self-evaluation checklist
After studying this chapter, you should be able to:
- Describe how the circular flow of income shows how income flows around the economy.
- Explain how income flows between households, firms and the government in a closed economy.
- Explain that in an open economy, there is also income coming into the economy from the sale of exports and an outflow of income used to purchase imports.
- Analyse the impact of leakages and injections on the circular flow of income.
- Explain how an economy is in equilibrium when injections equal leakages.
Want more practice? Drill this chapter's past-paper MCQs (32 questions) →