Chapter 10 — The Interaction of Demand and Supply
Cambridge International AS & A Level Economics (9708) · Unit 2.4 · 4th edition coursebook
Learning objectives
- Define equilibrium and disequilibrium and explain how the market clears.
- Show the effects of shifts in D and S on equilibrium price and quantity.
- Distinguish substitutes, complements, derived demand and joint supply.
- Analyse the rationing, signalling, transmission and incentive functions of price.
Key terms
- equilibrium
- A situation where there is no tendency to change in a market.
- disequilibrium
- A situation where demand and supply are not equal in a market.
- equilibrium price
- The price where demand and supply are equal, where the market clears.
- equilibrium quantity
- The amount that is traded at the equilibrium price.
- derived demand
- Where the demand for a good or service depends upon the use that can be made from it.
- joint supply
- When two items are produced together.
- rationing
- Where price limits consumption to those willing and able to pay.
- signalling
- Where decisions taken by buyers or sellers are determined by price.
- transmission of preferences
- The automatic way in which the market allows the wants of consumers to be made known to producers.
- incentive
- Where prices encourage buyers to consume and sellers to produce.
10.1Market equilibrium and disequilibrium
A market is in equilibrium when supply equals demand (Figure 10.2). Real markets are usually in disequilibrium: excess supply pushes prices down; excess demand pushes prices up (Figure 10.3). The price mechanism drives the market back to equilibrium. The numerical example for the PC market (Figure 10.4) shows the equilibrium price at $1400 with 4000 units traded.
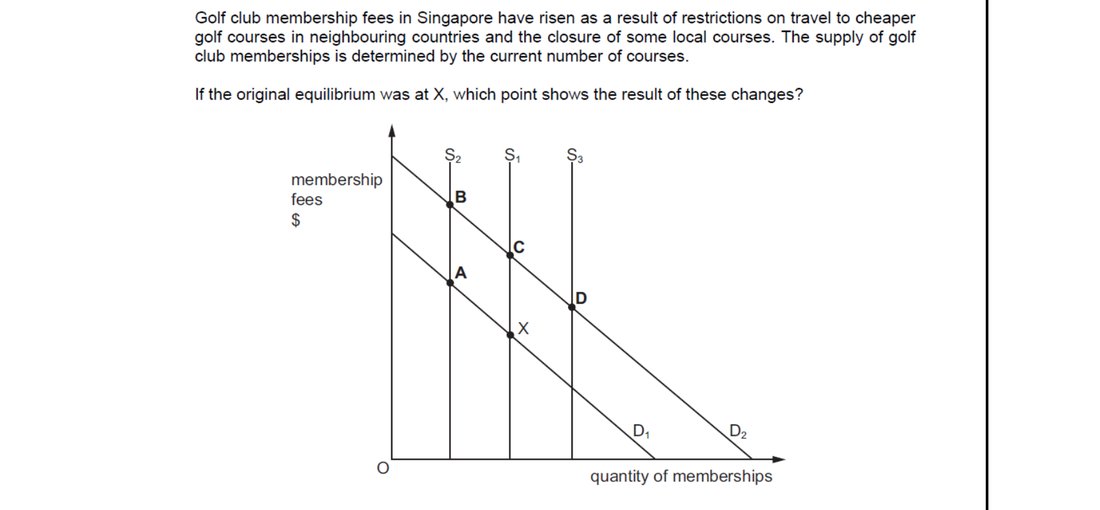
Travel restrictions raise demand for local memberships (D shifts right), while course closures cut supply (S shifts left). Because supply is fixed by existing courses (vertical short-run supply), the quantity barely rises while fees increase sharply. Option B – the point combining the leftward supply shift with a rightward demand shift, showing higher fees and roughly unchanged quantity – matches this combined outcome.
10.2Shifts in D and S on equilibrium
A rightward shift of D raises both price and quantity (Figure 10.6). A rightward shift of S raises quantity and lowers price (Figure 10.7). When both shift together (Figure 10.8), the direction of P is ambiguous but Q is determinate.
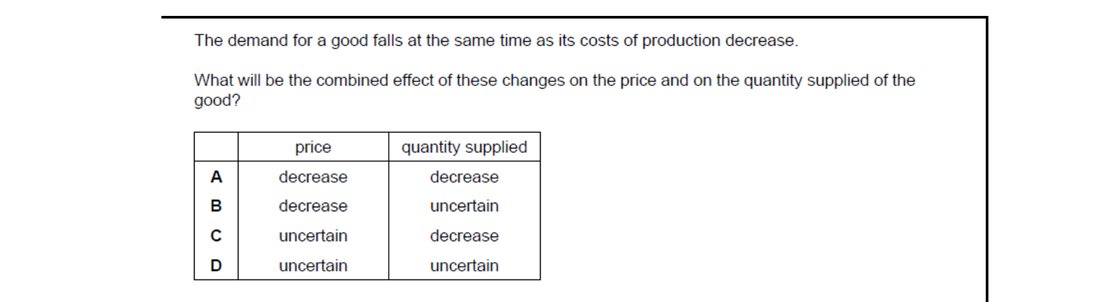
Lower production costs shift supply right (price down, quantity up); falling demand shifts demand left (price down, quantity down). Both effects reduce price unambiguously, but the quantity effect is offsetting and indeterminate. Option B – price decreases, quantity uncertain – captures this. The other rows make at least one direction definite where theory says it is ambiguous.
10.3Relationships between markets
Markets are linked. Substitutes: a rise in P(Y) raises D for X (Figure 10.11). Complements: a fall in P(Y) raises D for X (Figure 10.12). Derived demand (Figure 10.13). Joint supply (Figure 10.14).
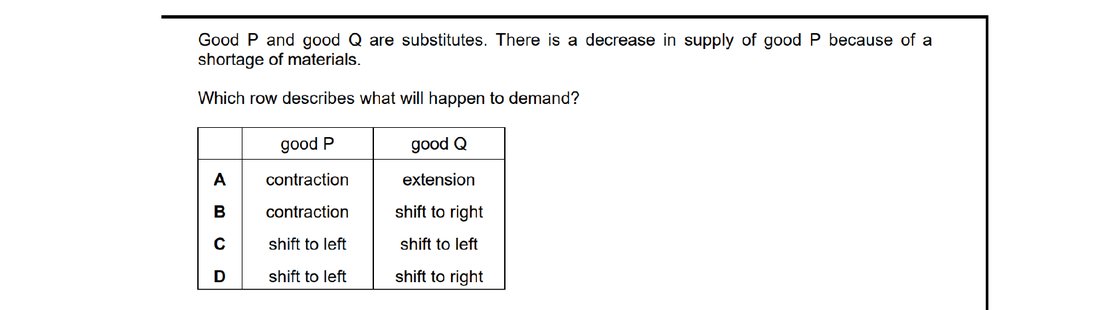
When the supply of P falls, P's price rises and its quantity falls (movement along its demand curve). Because Q is a substitute, consumers switch to Q, so Q's demand curve shifts to the right. Option B – contraction along the demand for P, shift to the right of demand for Q – captures both responses correctly.
10.4Functions of price
Price plays four functions in resource allocation: rationing, signalling, transmission of preferences, and incentive.
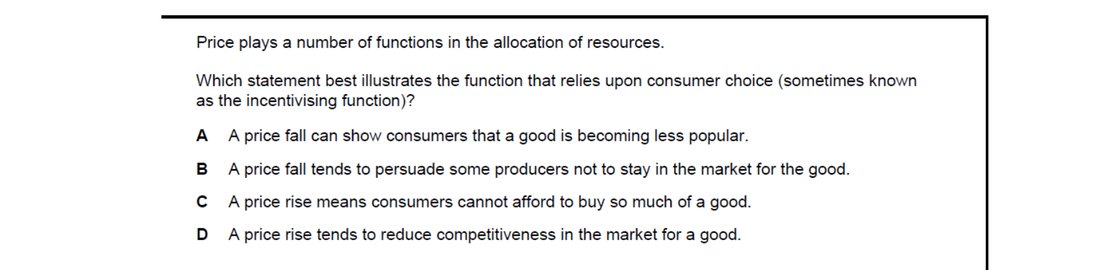
The incentive (or motivation) function rewards or discourages producers via the prospect of profit. Option B – a price fall persuading some producers to leave the market – shows price acting as a producer incentive: lower returns make the activity less attractive. Option A is the signalling function, C is rationing, and D is a competitive effect rather than incentivising.
End-of-chapter practice
Past-paper questions from CIE 9708. Pick A, B, C or D. Answers are saved on this device — press Download report (PDF) at the top to save them.
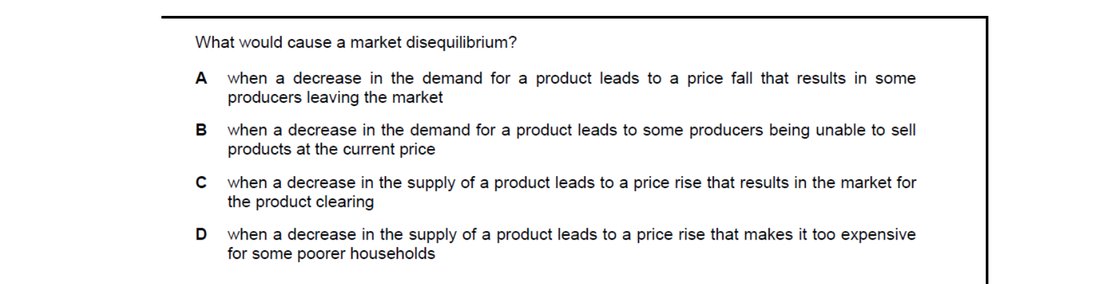
Disequilibrium exists when quantity demanded does not equal quantity supplied at the prevailing price. Option B – demand falls and producers cannot sell at the current price – describes a surplus while price has not yet adjusted, i.e. genuine disequilibrium. Options A and C both end with markets clearing (equilibrium), and D describes an equilibrium outcome that simply has distributional effects.
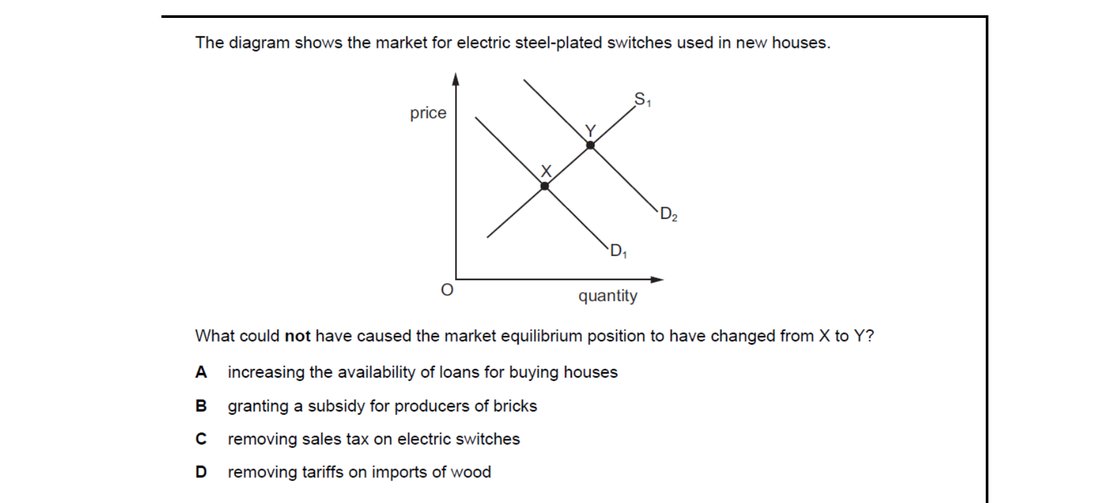
Movement from X to Y indicates the supply curve shifting right while demand is roughly unchanged or also shifting right. Option C – removing sales tax on switches – would shift demand for switches via the price effect rather than the supply curve and is not a supply-side cause of producers' costs falling. The other options (more housing loans, brick subsidy, no wood tariff) plausibly shift demand or supply rightward.
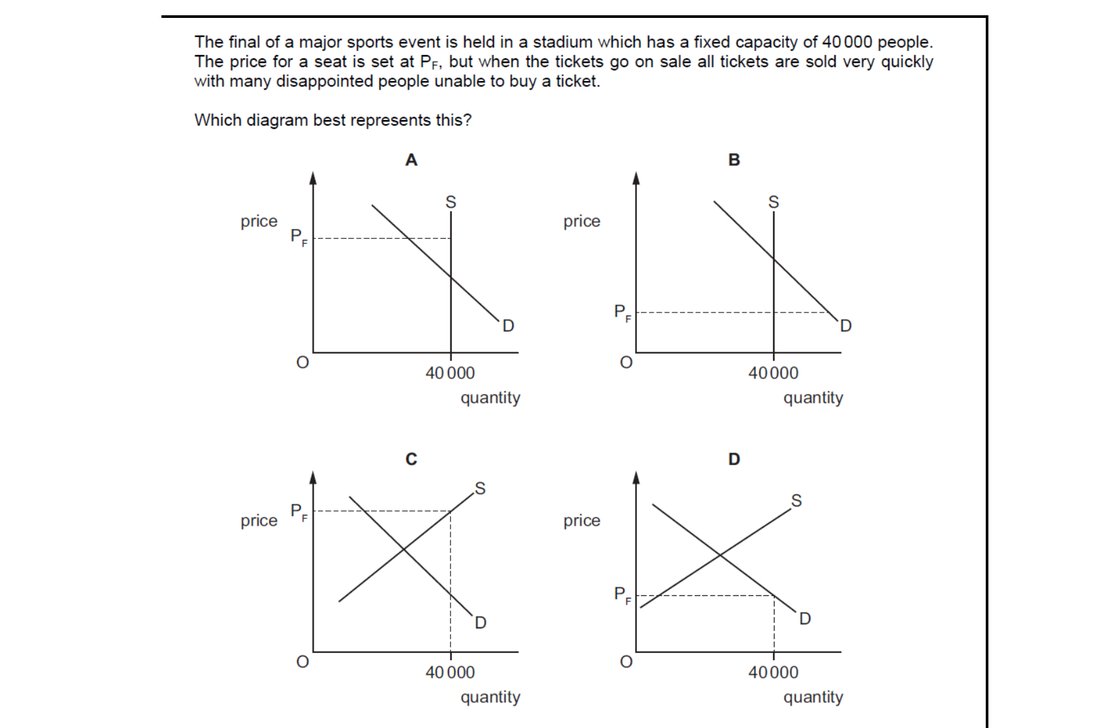
With stadium capacity fixed at 40000, supply is perfectly inelastic (vertical at 40000). At price PT the quantity demanded exceeds 40000, creating excess demand – many fans cannot buy tickets. Option B shows a vertical supply at 40000 cutting demand at PT with demand exceeding supply at that price. The other diagrams either show flexible supply or no shortage.
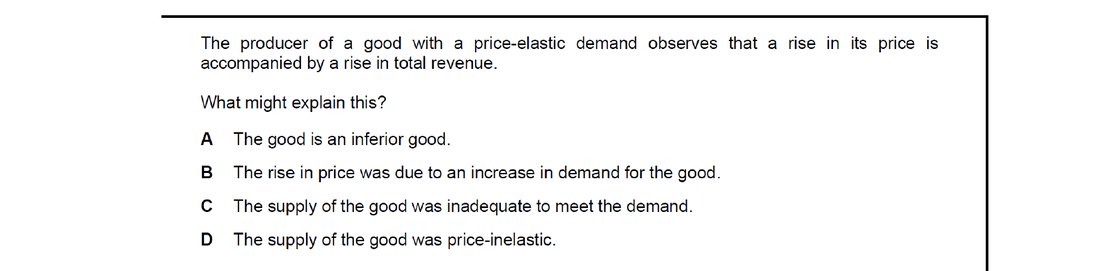
Normally, with price-elastic demand, a price rise lowers revenue. Revenue can rise only if the price rise reflects a demand increase rather than a supply contraction. Option B – the price rise was due to an increase in demand – means quantity also rises, lifting total revenue. Options A, C and D do not square with elastic demand simultaneously yielding higher revenue.
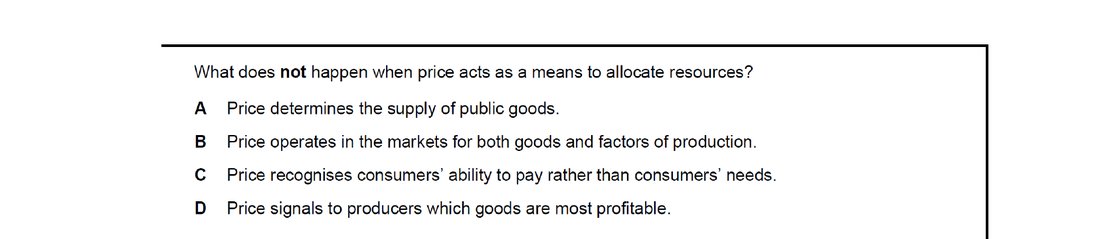
Price allocates resources by signalling, incentivising and rationing in private markets. It does not allocate public goods, which are non-excludable and non-rival, so private firms cannot charge for them. Option A – price does not determine the supply of public goods – is therefore the exception. Options B, C and D all describe genuine functions of price.
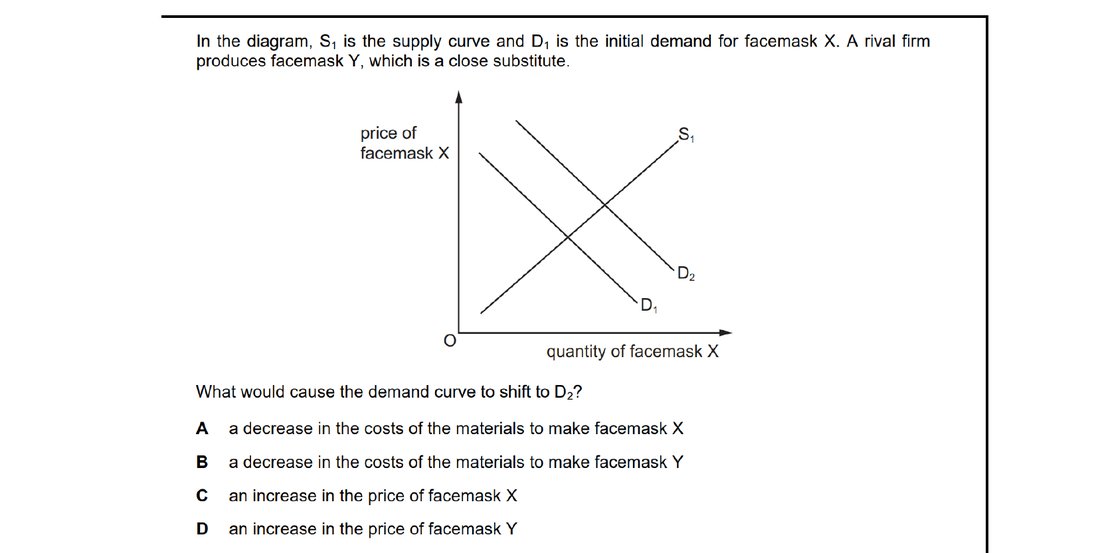
A shift to D2 must come from a change in conditions other than facemask X's own price. As facemask Y is a close substitute, a rise in Y's price makes X relatively cheaper, so consumers switch to X – its demand curve shifts right. Option D captures this substitute relationship. Options A and B affect supply, not demand; C causes a movement along the curve, not a shift.
Attempt the practice questions above to build your score.
Self-evaluation checklist
After studying this chapter, you should be able to:
- Identify and analyse equilibrium and disequilibrium.
- Show the effects of D and S shifts on equilibrium P and Q.
- Distinguish substitutes, complements, derived demand, joint supply.
- Analyse rationing, signalling, transmission and incentive functions.
Want more practice? Drill this chapter's past-paper MCQs (178 questions) →